
The route is six kilometres long. The proposed SFP is described as a ten-kilometre module. That sounds like four kilometres of spare capacity, but distance is not an optical power margin.
The receiver must obtain a signal within its specified operating range after the complete path has introduced loss. Fiber length matters, but so do connectors, splices, patching and any other optical components. Compatibility also depends on wavelength, fiber type, data rate and the host interface.
A fiber link budget puts those conditions into a form that can be checked before ordering. It also gives the commissioning team a target against which to compare the installed route.
Keep dBm and dB in their proper roles
Optical power levels are commonly specified in dBm. Losses and differences between power levels are expressed in dB. Subtract the permitted receiver sensitivity from the relevant minimum transmit power to obtain an available power budget in dB.
For a simple unamplified link, the planning relationship is:
Remaining margin = minimum transmit power − receiver sensitivity − total path loss.
Cisco's optical planning guide explains this power-and-loss relationship. Its particular system recommendations should not be treated as universal limits for unrelated Ethernet optics. Use the selected transceivers' specified conditions and the project's justified margin.
Calculate each transmission direction. A bidirectional pair may use different wavelengths, and the two receivers may not have identical specifications. A successful calculation in one direction is not sufficient evidence for the reverse path.
Build the loss estimate from the actual route
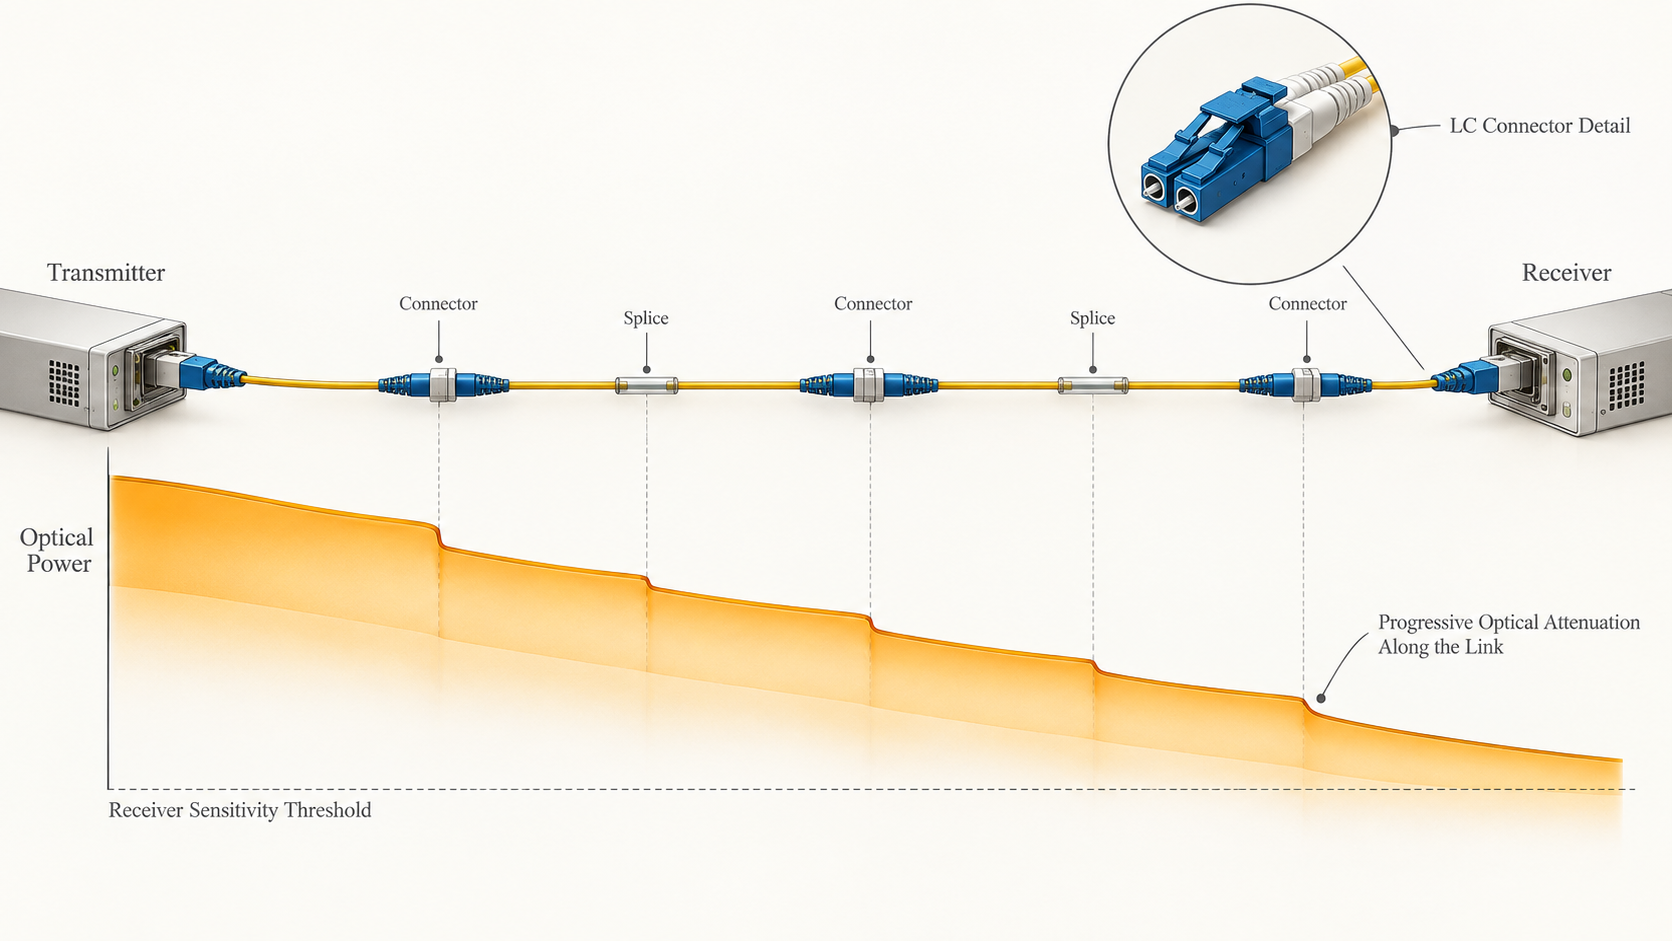
List the installed fiber length, all mated connector pairs, splices and any additional optical elements. Include patch panels and patch leads within the boundary being assessed. State the wavelength used for each fiber-attenuation assumption.
Use the approved cable and component data rather than borrowing universal connector or splice values from a convenient example. The count matters as much as the allowance: six connector interfaces on a drawing are not necessarily six mated connector pairs. Define what the worksheet counts.
A worked example with an explicit margin
Assume an illustrative transceiver has a minimum transmit power of −8 dBm and the remote receiver's specified sensitivity is −20 dBm under the required conditions. The available budget is 12 dB. These are example figures, not a specification for a TODAHIKA module.
For the proposed route, use the following planning assumptions:
| Loss item | Example calculation | Estimated loss |
|---|---|---|
| Six kilometres of fiber at the chosen wavelength | 6 × 0.35 dB/km | 2.1 dB |
| Four mated connector pairs | 4 × 0.5 dB | 2.0 dB |
| Six splices | 6 × 0.1 dB | 0.6 dB |
| Total estimated path loss | 2.1 + 2.0 + 0.6 | 4.7 dB |
The estimated received power at minimum launch is −12.7 dBm: −8 dBm minus 4.7 dB. The difference above the assumed −20 dBm sensitivity is 7.3 dB. If the project reserves an illustrative 3 dB for its stated engineering allowance, 4.3 dB remains unallocated in this example.
That last figure is meaningful only because its assumptions are visible. It is not permission to add an unspecified number of patch panels or to ignore a failed cable test. Replace every example value with the selected equipment and route data, then compare the installed measurement with the accepted budget.
Check the upper receive-power limit too
Too little received power is only one boundary. A short, low-loss path paired with a high-output optic can exceed the receiver's supported input range. Review maximum transmit power, minimum path loss and the specified maximum receiver input.
For illustration, a maximum launch of +3 dBm and only 1 dB of path loss would produce approximately +2 dBm at the receiver. If that receiver's permitted maximum input were −1 dBm, the proposed combination would exceed it. The selected product documentation must determine the remedy, including any approved attenuator and its placement.
Do not equate an overload limit with a guaranteed damage threshold; those are different specifications. Also avoid assuming every long-reach optic requires attenuation on a short patch lead. Check the actual maximum-output and receiver-input relationship before making the decision.
Distance and power do not settle every compatibility question
Confirm the data rate and supported interface at both hosts. A physical SFP cage does not automatically support every module that fits it. Check fiber type, connector and polish compatibility, wavelength arrangement and any host-specific qualification requirement.
Cisco's Gigabit SFP datasheet illustrates how optical modules differ in these characteristics and in temperature range. Use the corresponding documentation for the actual purchased modules. Do not infer a whole specification from a distance suffix.
Remember that an optical budget is one part of the interface requirements. Depending on the optical technology, dispersion and other limits may also apply. A positive power margin does not override the module's supported fiber and reach conditions.
Compare calculation, installed loss and operating diagnostics
The design estimate predicts whether a proposed route should be supportable. An appropriate installed-fiber loss test checks the completed path against the selected limits. Operating diagnostics, where supported, provide information about the running transceivers. These forms of evidence complement each other.
Digital optical monitoring readings can help identify a change over time, but their accuracy and availability are product-specific. They should not automatically replace an agreed cable-certification procedure. An OTDR can help locate events; a total insertion-loss measurement answers a different question about end-to-end loss. Select the test method according to the acceptance requirement.
Before connecting or retesting, follow proper connector inspection and cleaning procedures. Fluke Networks' fiber-inspection guidance explains why cleaning should be followed by inspection rather than assumed successful. Record persistent high-loss events instead of repeatedly swapping optics without checking the path.
Make a marginal result actionable
If measured loss is higher than the worksheet predicted, reconcile the difference. Check the route inventory, connector condition, splices and test setup. A longer-than-drawn route or an undocumented intermediate panel changes the design; a contaminated connector calls for a different correction.
After a correction, preserve the before-and-after result and update the accepted route record. Do not simply widen the acceptance limit until the test passes. If the route cannot meet the required budget, evaluate a compatible optical alternative and repeat both the low-power and high-power boundary checks.
For an intermittent fault, compare optical diagnostics with interface errors and environmental conditions. A receiver reading within its nominal range at one moment does not rule out an intermittent connection, temperature-related issue or another network fault.
What to send with an industrial fiber inquiry
Provide the route length, fiber type, connector arrangement, estimated or measured loss, operating environment and required interface speed. For a TODAHIKA media converter or fiber-connected industrial switch, request the exact host and module combination with both directions identified.
Retain the approved budget, installed test results, module labels and baseline diagnostics in the handover package. The next replacement can then be checked against an optical system with defined boundaries, rather than selected from a distance number that never described the complete route.
Post time: Oct-03-2026


